I have had the pleasure of working with universities, educators, science museums, art museums, filmmakers, interactive artists, and consumer electronics companies. A common thread to all has been the opportunity to work on innovative media-oriented software in a variety of projects, including interactive museum exhibits, data visualizations, tools for filmmakers, early prototypes of high profile consumer electronics, educational software, and special effects for music videos. Some common themes threading these projects:
- strong visual components
- integrating software and hardware
- having fun exploring, designing, and developing
I am privileged to collaborate with extremely talented analysts, biomechanists, and coaches to develop apps based on rich baseball datasets for internal team use.
- React-three-fiber, Threejs, React, D3
- TypeScript
- Sketch
- HawkEye pose tracking

I worked with analysts, designers, and data scientists to explore new ways of presenting ball and player tracking, both for public facing apps and internal MLB use. I designed and developed web apps, posters, and charts with 3D tracking data. I participated in an MLB ideation group to explore new forms of baseball data visualization.
Sample Projects
- React-three-fiber, Threejs, React, D3
- JavaScript, TypeScript
- HawkEye, TrackMan, Chyron Hego
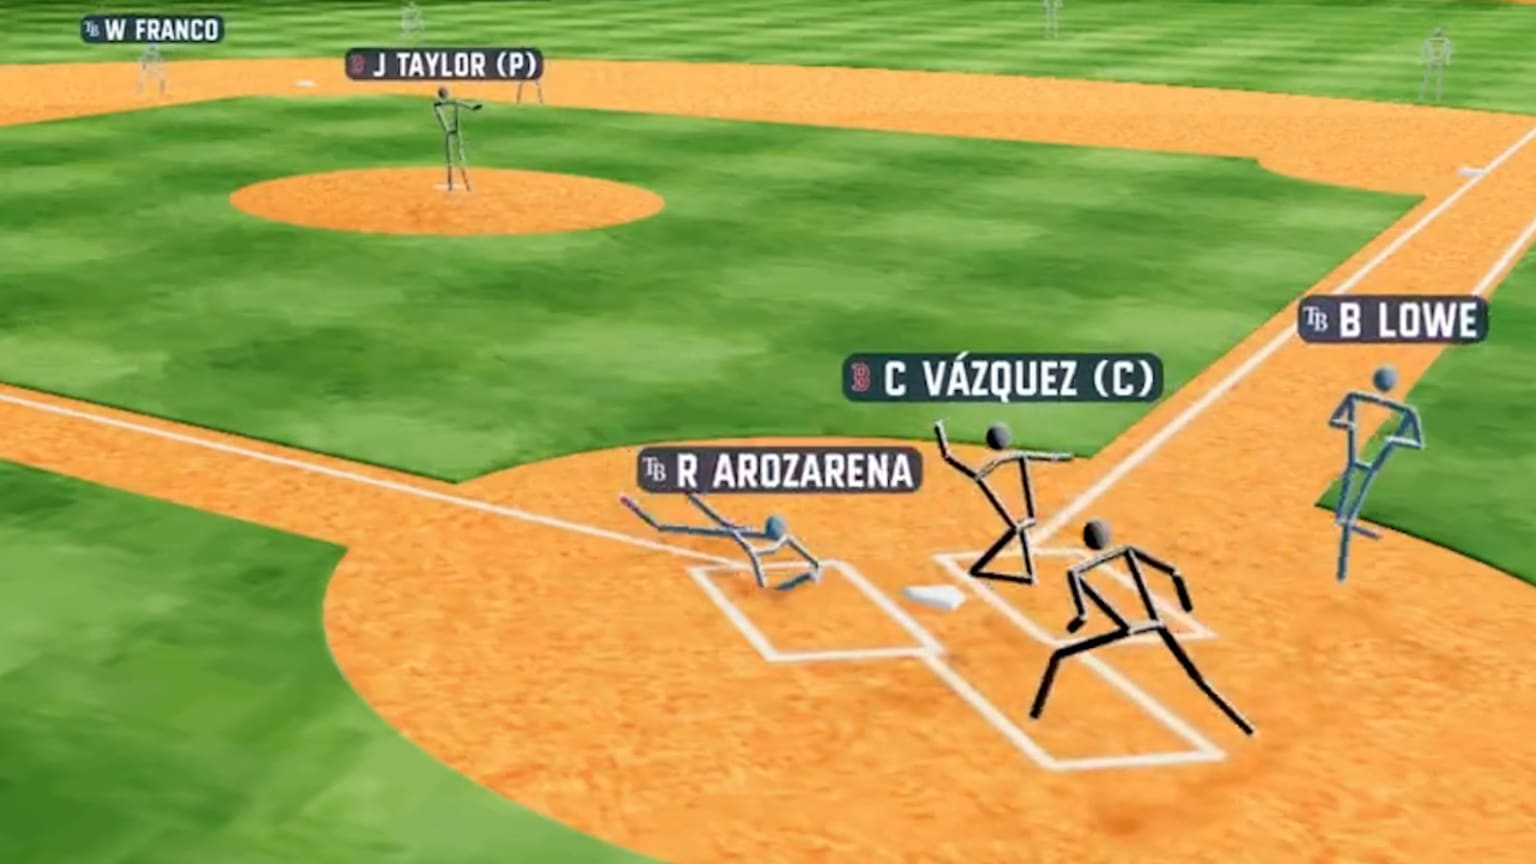 MLB FieldVision
- This was a fairly long term project that began with my crafting a prototype to demonstrate
the viability of rendering Hawkeye player tracking in a web app at interactive rates. The
prototype was a success and led to an internal tool for analyzing baseball plays. Eventually,
the project grew to include a team of developers and designers to produce a public
facing variation for MLB.com and MLB Network.
MLB FieldVision
- This was a fairly long term project that began with my crafting a prototype to demonstrate
the viability of rendering Hawkeye player tracking in a web app at interactive rates. The
prototype was a success and led to an internal tool for analyzing baseball plays. Eventually,
the project grew to include a team of developers and designers to produce a public
facing variation for MLB.com and MLB Network.
2022 SABR Analytics: MLB FieldVision Demo and Deep Dive
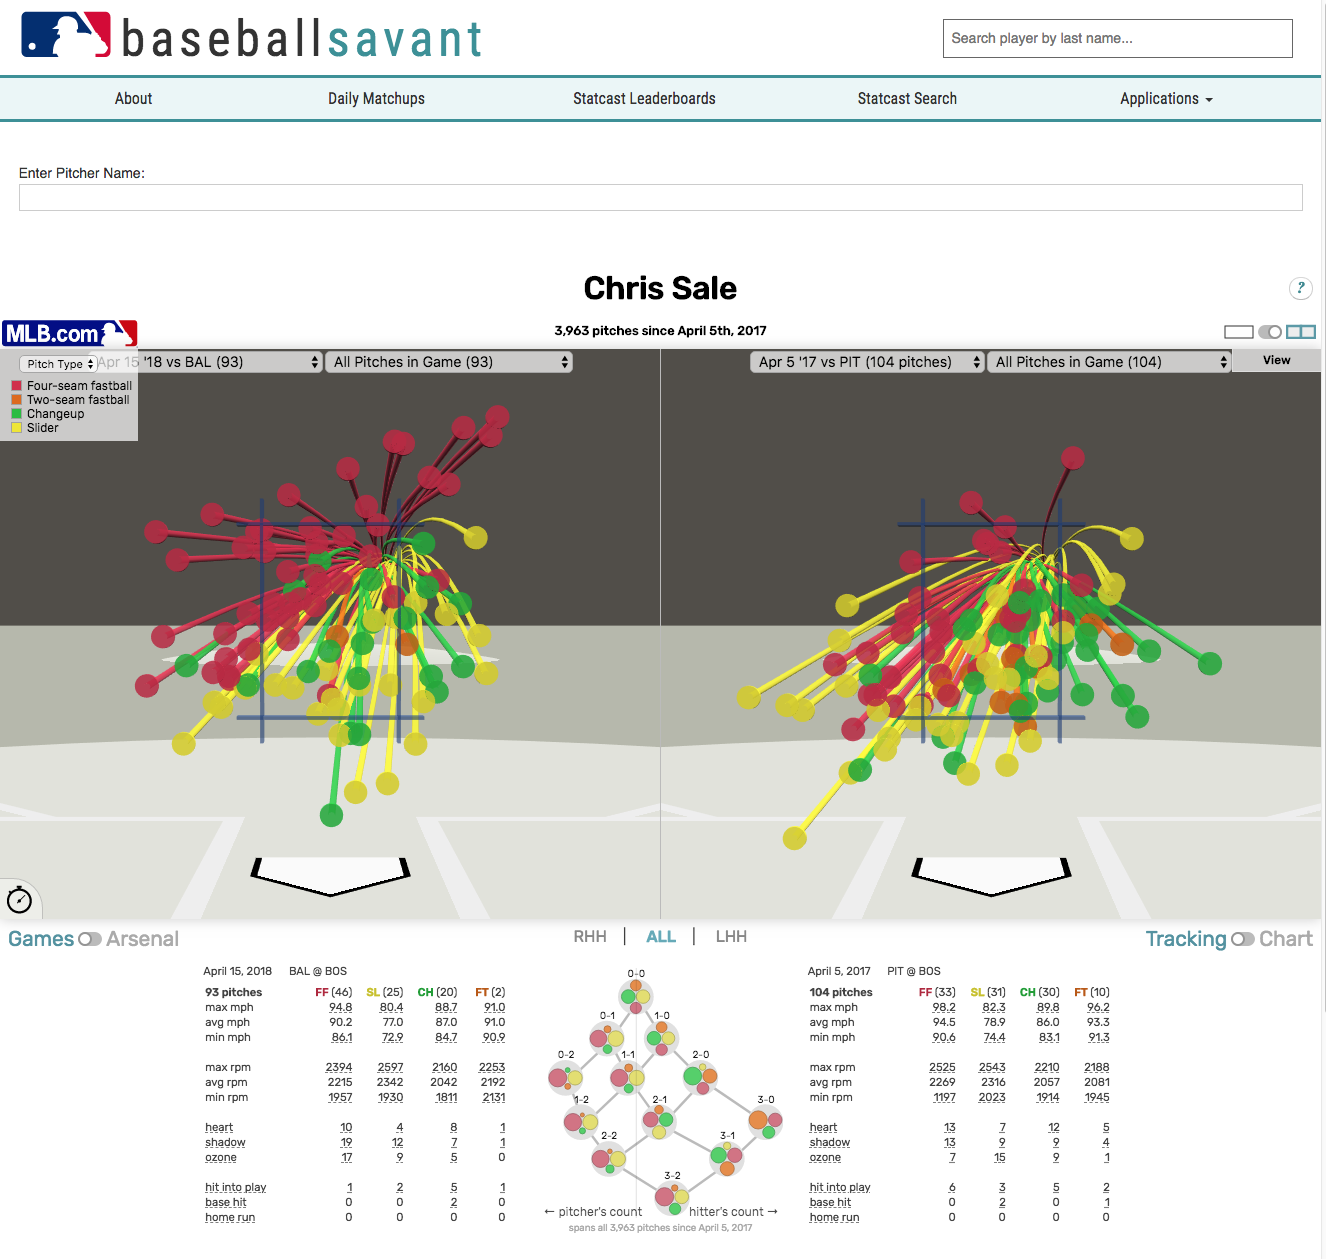 3D Pitch Visualization
- This web app navigates all of a given pitcher's pitches, by season, by game, down to
individual plate appearances. It combines 3D pitch tracks with tables and 2D visualizations
for exploring groups of pitches in multiple ways.
3D Pitch Visualization
- This web app navigates all of a given pitcher's pitches, by season, by game, down to
individual plate appearances. It combines 3D pitch tracks with tables and 2D visualizations
for exploring groups of pitches in multiple ways.
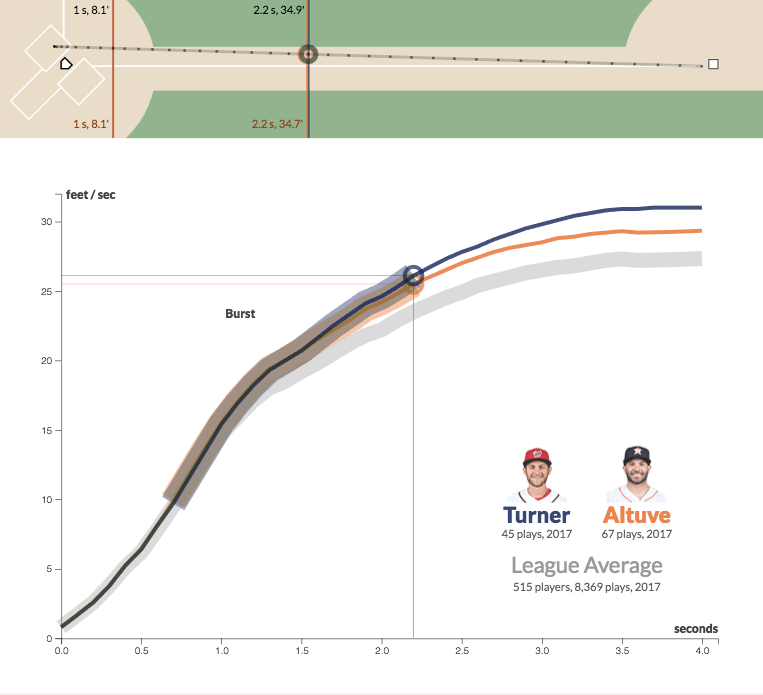 Sprint Speed and Burst
- This scroller explains new terminology and stats regarding base running by leading the viewer
through how tracking data is aggregated and processed, then compares the speed profiles of a
pair of
elite runners.
Sprint Speed and Burst
- This scroller explains new terminology and stats regarding base running by leading the viewer
through how tracking data is aggregated and processed, then compares the speed profiles of a
pair of
elite runners.
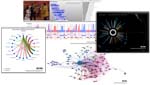
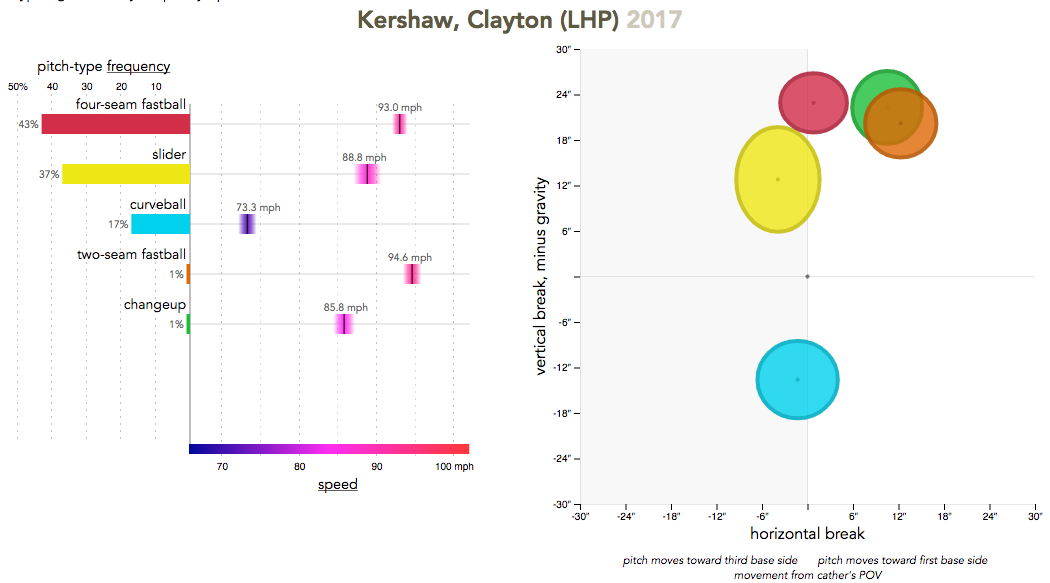 PitchMix
- Displays pitching signatures through interactive charts of fundamental pitching
characteristics:
pitch-type frequency, speed, and movement.
PitchMix
- Displays pitching signatures through interactive charts of fundamental pitching
characteristics:
pitch-type frequency, speed, and movement.
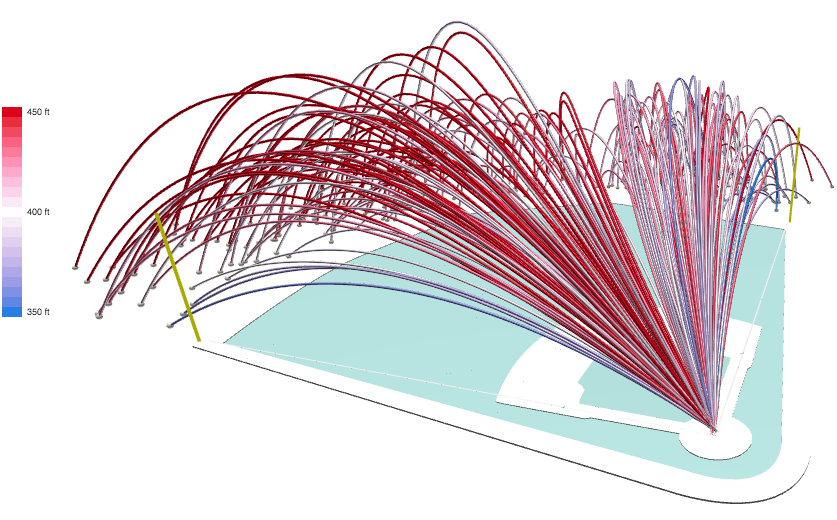 Home Run Derby
- This 3D rendering of home run arcs animates hits in real time during the derby at each
summer's
All Star game, then presents all the hits for interactive review anytime afterward.
Home Run Derby
- This 3D rendering of home run arcs animates hits in real time during the derby at each
summer's
All Star game, then presents all the hits for interactive review anytime afterward.

I was a member of a small strategic team at Microsoft, developing early functional prototypes of NUI (natural user interface) scenarios that employ emerging sensing technologies. We used a variety of sensor mechanisms to glean insights into people's attention and intention while they interact with a range of devices. The primary focus was on UX design, exploring how to effectively utilize new sensors with combinations of mobile, multi-touch, and pen/digital-ink, while also considering how to integrate new technologies into legacy keyboard/mouse UI scenarios.
- C#, C++, C++/CLI
- Windows 8 Modern apps, WPF
- JavaScript, jQuery, Processing, D3
- multi-touch screens, pen/digital-ink
- Leap Motion, Kinect, and other sensors

Volunteering for Illuminate the Arts, I designed and implemented an interactive visualization for the GIFT OF LIGHT (← see bottom of page). GIFT OF LIGHT is a grass-roots fundraising effort for the Bay Lights art installation of ~25,000 LEDs on the Bay Bridge. The visualization provides a way for patrons to select individual lights to sponsor and tag with a photo and a personal message.
- JavaScript, D3
Related Content Database, now named Watchwith,
offers a platform to create and publish time-based metadata for film and television.
 Movie Tagger - Worked with USC's
School
of Cinematic Arts, exploring how visualization of timed metadata can augment film studies.
Movie Tagger - Worked with USC's
School
of Cinematic Arts, exploring how visualization of timed metadata can augment film studies.
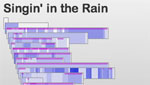 Time Data - Visualizations of timed
metadata
for thousands of movies and TV shows.
Time Data - Visualizations of timed
metadata
for thousands of movies and TV shows.
 Netflix - Worked at Netflix on behalf of RCDb to help develop Netflix's first streaming
service on the Sony Playstation.
Netflix - Worked at Netflix on behalf of RCDb to help develop Netflix's first streaming
service on the Sony Playstation.
 BD-J - Numerous projects integrating web APIs (e.g. Flickr, Amazon, Google Maps, NYTimes,
Picasa) with Blu-ray viewing experiences.
BD-J - Numerous projects integrating web APIs (e.g. Flickr, Amazon, Google Maps, NYTimes,
Picasa) with Blu-ray viewing experiences.
- JavaScript, jQuery, Paper.js, Processing.js
- Java, Processing, Python, R, SQLite
- BD-J, Quicktime
Moto Development Group helped lead products from conception through design, prototyping, and production. I began at Moto writing embedded software, primarily C++, for MP3 players. Eventually, I worked more on functional prototypes, mostly in Java for clients including Apple, Amazon, Microsoft, and BMW.
Multi-touch displays - Developed particle physics simulations to explore ways of integrating touch and tilt in a responsive interface for very early display prototypes that eventually went into the first iPhone and iPad.
Kindle prototype - Java on a laptop, controlling E Ink display, touchpad, buttons and keyboard for the first functional Kindle prototype.
Zune touchpad - Java on a laptop, controlling an early prototype for the Zune touchpad, tuning response to touch behaviors.
Portal Player - Several CES demos showing Portal Player chips (the SOC in the first iPods) driving MP3 players.- Java, Processing, C++, C#, Max/MSP
At Panavision, I developed early digital video assist systems that enhanced directorial review and continuity checking. The two main aspects of the work involved integrating a variety of devices and producing a streamlined user interface to control recording and playback.
We aimed to provide innovative tools to filmmakers. Panavision rented (and painstakingly maintained) cameras and associated equipment for roughly 80% of the feature film market. Digital was looming. We worked with Kodak then, exploring digital pre-visualization on film sets (to save time and money preventing wasted shots). So, we started with serial control of tape decks from a computer (much like the early 16-deck Montage video edit system), then expanded to a purely digital route - controlling a Tektronix Profile, which featured 4 video channels, 8 audio channels, and a home-base channel of timecode. We could record up to 9GB of video on each channel - crazy huge gobs of video in the late 90s.
I was a member of the MIT Media Lab's Interactive Cinema Group (IC) in the early 90s. IC used emerging video technologies to investigate new forms of story telling, and new tools for composing media. When I joined IC, analog laserdiscs represented the state-of-the-art for interactive video. Quicktime soon arrived, and multimedia CDs were on the horizon. My Video Streamer project employed digital video to look at new ways of visualizing temporal aspects of video.
- C++, HyperTalk
- Quicktime
When you visit the Museum of the Moving Image, you are invited to record a short video clip of yourself to print out and assemble a flip book souvenir of your visit. I developed a three-workstation exhibit that controls lighting and a camera for recording, then sends the video to a review workstation at the gift shop, with a printer workstation for staff to print purchased flip books.
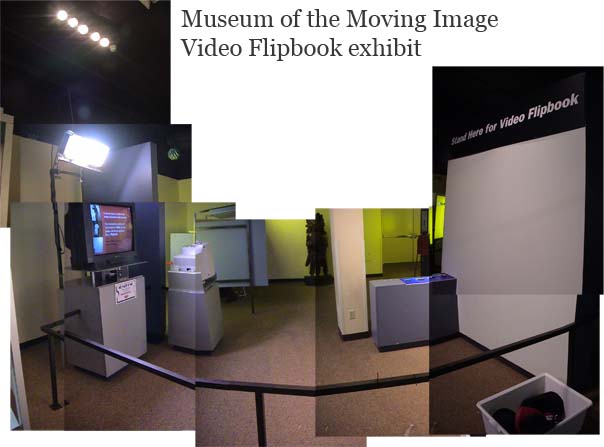
- video capture - leads visitors through setup (tilt/zoom camera), recording (controls lights and camera), and playback
- video browser - presents the hundreds of clips recorded in a day, letting visitors review their clip and others
- printer - formats video frames as flipbook pages and prints them out
Working with the Boston University math department, I developed a series of applications for students to experiment with dynamic characteristics of fractals. Through BU, I also adapted my Video Streamer software for an exhibit on fractal aggregation in crystal growth at Boston's Museum of Science.
Crystal Graphics
At Crystal Graphics I developed a
package
for designing page turn effects in the Crystal Graphics 3D animation system. The main trick was
developing a real-time wireframe preview so that designers could refine the effect they wanted
before
they let their IBM 280, or 360 if they were lucky, go animate the full-res version overnight. Page
turns
were common transition effects in the late 80s, first made practical with the Quantel Mirage real-time
digital video effects device, which I worked with in video post production houses in San Francisco
and
Mexico City in my years prior to Crystal Graphics.